Introduction
Sensitivity Analysis is a financial modeling tool that examines how the values of a group of independent variables affect a single dependent variable under specified situations. Professionals apply sensitivity analysis—also known as a what-if study—across various domains, including biology, geography, economics, and engineering. In the corporate and economic sectors, financial analysts and economists frequently use it to assess different scenarios. It is particularly beneficial for studying and analyzing processes where the outcome is an opaque function of numerous inputs. An opaque function or process cannot be studied or analyzed. Climate models in geography, for example, are typically highly sophisticated. As a result, the precise relationship between the inputs and outputs is unknown.
Under a given set of assumptions, sensitivity analysis evaluates how various elements of an independent variable affect a specific dependent variable. In other words, sensitivity analyses look at how various sources of uncertainty in a mathematical model affect the total uncertainty of the model. This strategy is applied within certain boundaries dependent on one or more input variables.
Financial analysts most typically use a Financial Sensitivity Analysis, also known as a What-If analysis or a What-If simulation exercise, to forecast the outcome of a given action when executed under certain conditions. Financial Sensitivity Analysis is conducted within specific parameters set by independent variables.
Advantages of Sensitivity Analysis
The use of sensitivity analysis has several advantages. It is vital to remember that sensitivity analysis employs a set of outcomes based on assumptions and variables, which are then assessed against historical data. As a result, a sensitivity analysis is a model with some room for error that may or may not be completely accurate, but it is a practical and extensively used technique. The following are the main advantages of employing it:

Advantages of Sensitivity Analysis
Decision making
It gives decision-makers diverse options to choose from to make better business judgments. Sensitivity analysis aids in making well-informed decisions. Decision-makers use the model to decide how responsive the output is to changes in certain factors. As a result, the analyst can help in drawing factual findings and making the best judgments possible.
Predictions
It thoroughly examines factors, resulting in more accurate forecasts and models.
Areas for improvement
Sensitivity Analysis aids decision-makers in deciding where future improvements should be made. The analyst can be more flexible with the boundaries within which to assess the sensitivities of the dependent variables to the independent variables using Financial Sensitivity Analysis.
Credibility
Financial models gain credibility through sensitivity analysis, which assesses them across various scenarios.
Processes in Sensitivity Analysis
Sensitivity Analysis is a business model that shows how input factors change affect target variables. What-if or simulation analysis is other terms for this model. It is a method of predicting a decision’s outcome based on variables. An analyst can assess the impact of a change in one variable on the outcome by constructing a collection of variables. When performing a sensitivity analysis, analysts thoroughly examine both the input (independent) and goal (dependent) variables. They assess how changes in input variables influence the target outcome. Each sensitivity analysis typically involves three steps:
Processes in Sensitivity Analysis
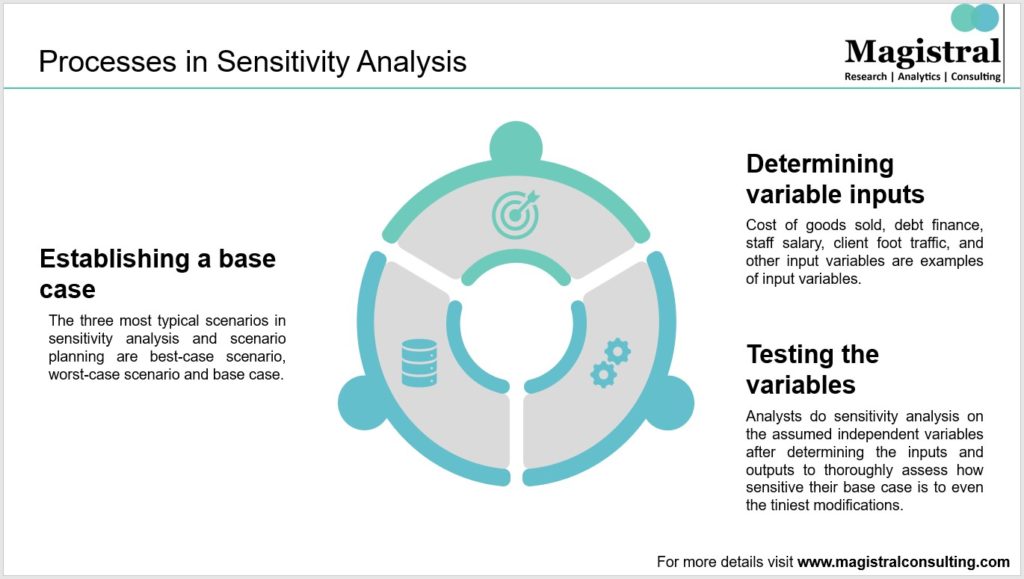
Establishing a base case
The three most typical scenarios in sensitivity analysis and scenario planning are:
-The best-case scenario, or the most optimistic scenario with the most upside potential
-The worst-case scenario or the most pessimistic situation with the most significant risk of failure.
-The base case, or the most cautious scenario, results in the middle of the best and worst-case possibilities.
Once they establish a plausible base case scenario, analysts will identify the most important independent and dependent factors influencing the outcome.
Determining variable inputs
Cost of goods sold, debt finance, staff salary, client foot traffic, and other input variables are examples of input variables. Cash flows, internal rate of return, net present value (NPV), and net profits are examples of output variables. For example, analysts often use net present value, which accounts for the time value of money, to estimate if a project will be lucrative.
Initial capital, the acceptable rate of return, and the return on investment from cash flows are all factors in NPV.
Testing the variables
Analysts do sensitivity analysis on the assumed independent variables after figuring out the inputs and outputs to thoroughly assess how sensitive their base case is to even the tiniest modifications.
Because it acts as a control, it is critical to use the base case as a frame of reference for the OAT analysis. Without a realistic base case scenario, there is no way to know how the best-case and worst-case possibilities will be affected. Multiple-input variables are more likely to change simultaneously or sequentially in the real world, often in dramatic and unpredictable ways.
Top Practices in Sensitivity Analysis
Layouts in Excel
For a successful sensitivity analysis in Excel, the layout, structure, and strategy are critical. If a model is poorly arranged, it confuses both the creator and the users and increases the chances of errors in the analysis.
The following are the most critical considerations for Excel layout include putting all the assumptions in one place in the model, formatting all assumptions in a different font color to make them stand out, considering which assumptions to test – only the most critical ones carefully and creating a separate section for the analysis using grouping.
Direct vs. Indirect methods
Different numbers are substituted into a model’s assumption in the direct method. Instead of directly altering the value of an assumption, the indirect method inserts a % change into calculations in the model.
Tables, charts, and graphs
Even the most informed and technically sophisticated finance experts may find it challenging to understand. Therefore, presenting the results in an easy-to-understand and follow format is critical.
Data tables are an excellent method to explain how changing up to two independent factors affects a dependent variable. The data table below illustrates changes in revenue growth and the EV/EBITDA multiple on a company’s stock price. Tornado charts are an excellent method to simultaneously display the impact of multiple variables. Analysts name them Tornado Charts because they arrange the items to resemble a tornado cone, placing the most impactful items at the top and the least impactful ones at the bottom.
Limitations in Performing Sensitivity Analysis
Analysts most commonly use Excel to create financial models. However, spreadsheets often fall short—they require extensive manual entry and offer little room for error. Conducting multidimensional analysis in a two-dimensional spreadsheet is also challenging. When stakeholders present new questions, analysts frequently return to the drawing board to build entirely new spreadsheets. These are significant to why intelligent firms should consider employing sensitivity analysis-specific financial modeling tools.
Magistral’s services on Sensitivity Analysis
Experts have long regarded financial models as a reliable method for identifying the contours of trade. Investors have recently tweaked traditional financial models qualitatively, driven by a wave of acquisitions where they pay significant premiums for explosive growth or high-impact technology. The sensitivity analysis provided by Magistral ensures the following:
-Analyzing the financial model’s unclear input values
-Predicting potential outcomes and planning for unanticipated risks
-Aiding the execution of risk assessment techniques
-Establishing co-relationships between the model’s multiple inputs and output.
-Execution of well-informed judgments
About Magistral consulting
Magistral Consulting has helped multiple funds and companies in outsourcing operations activities. It has service offerings for Private Equity, Venture Capital, Family Offices, Investment Banks, Asset Managers, Hedge Funds, Financial Consultants, Real Estate, REITs, RE funds, Corporates and Portfolio companies. Its functional expertise is in Deal origination, Deal Execution, Due Diligence, Financial Modeling, Portfolio Management and Equity Research.
For setting up an appointment with a Magistral representative visit www.magistralconsulting.com/contact
About the Author
The article is Authored by Marketing Department of Magistral Consulting. For any business inquiries, you could reach out to prabhash.choudhary@magistralconsulting.com