Tag Archives: Sensitivity analysis outsourcing

Introduction

Sensitivity Analysis establishes the impact of various independent variable values on a specific dependent variable under a specific set of assumptions. In other words, sensitivity analyses look at how different types of uncertainty in a mathematical model affect the overall level of uncertainty. This method is applied within defined parameters that are dependent on one or more input variables.

In the realm of business and the study of economics, sensitivity analysis is applied. It is sometimes referred to as a “what-if analysis,” and financial analysts and economists frequently employ it. Finance sensitivity analysis aids in the understanding of potential risks, uncertainties, and trade-offs related to financial decisions. It facilitates risk management, permits informed decision-making, and improves comprehension of the spectrum of potential outcomes in various financial circumstances.

Share price predictions for publicly traded firms can be aided by sensitivity analysis. A few elements that affect stock prices are the company’s earnings, the number of shares in circulation, the ratio of debt to equity (D/E), and the number of opponents in the market. Examining future stock prices can be enhanced by altering the underlying hypotheses or introducing new factors. Using this model, it is possible to determine how changing interest rates affect bond prices. It enables the use of actual historical data for forecasting. Carefully examining all the elements and potential outcomes can help one make crucial decisions about investment, businesses, and the economy.

Applications of Sensitivity Analysis

Sensitivity analysis is a popular tool in finance for determining how changes in input variables or assumptions would affect risk management, investment choices, and other financial applications. Finance sensitivity analysis offers insightful information about potential risks, uncertainties, and trade-offs related to financial models, investment choices, and risk management tactics. It helps with decision-making, risk quantification, portfolio optimization, and improving comprehension of the effects of numerous factors on financial results.

Application of Sensitivity Analysis

Applications of Sensitivity Analysis

The following are some crucial financial uses of sensitivity analysis:

Pricing and Estimation

Sensitivity analysis is essential for evaluating complicated derivatives, options, bonds, and other financial instruments. Analysts can determine how sensitive the value of an instrument is to various inputs, such as underlying asset prices, interest rates, volatility, or dividend yields. It aids in assessing the impact of changes in market conditions on the pricing of financial instruments as well as recognizing the main drivers of value.

Risk Mitigation

It is useful to comprehend how different market conditions affect portfolio returns, value-at-risk (VaR), or other risk assessments. Sensitivity analysis is used to facilitate stress testing, scenario analysis, and assessing the resilience of financial institutions or portfolios to volatile market conditions.

Asset Distribution and Portfolio Management

Asset allocation and portfolio optimization are accomplished through sensitivity analysis. Analysts can determine the best allocation techniques by evaluating how responsive portfolio returns, risk measures or other performance indicators are to changes in asset weights, correlations, or other portfolio parameters. It helps in assessing the possible effects of asset class returns, monetary considerations, or market conditions on portfolio performance and serves as a roadmap for portfolio modifications.

Making Decisions and Budget Allocation

Financial statement sensitivity to changes in revenue growth rates, cost structures, or interest rates can be assessed by analysts for financial statements like income statements, balance sheets, or cash flow statements. Sensitivity analysis supports decision-making by shedding light on the potential effects of various scenarios on financial performance.

Assessing Investments and Capital Planning

Analysts can determine the sensitivity of investment indicators such as net present value (NPV), internal rate of return (IRR), or payback duration by adjusting important parameters like cash flows, discount rates, or project timelines. This research aids in understanding the range of probable outcomes for various investment situations as well as the most important elements affecting investment profitability.

Benefits of Sensitivity Analysis

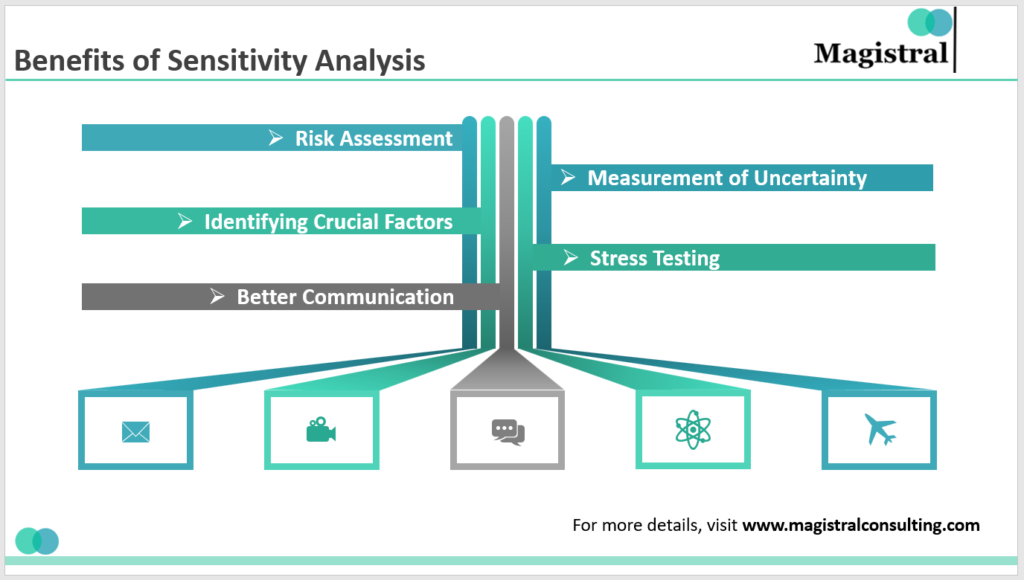
Sensitivity analysis in finance offers several benefits that contribute to better decision-making, risk management, and understanding of financial outcomes. It in finance aids in improved risk management, more informed decision-making, and a deeper comprehension of the range of possible outcomes. It aids in quantifying uncertainty, identifying crucial elements, and enhancing stakeholder communication, ultimately resulting in more solid and trustworthy financial strategies and plans. Here are some key benefits of sensitivity analysis in finance:

Benefits of Sensitivity Analysis

Benefits of Sensitivity Analysis

Risk Assessment of Sensitivity Analysis

Sensitivity analysis is a tool for evaluating and controlling risks related to financial models, portfolios, or investment choices. Analysts can detect and quantify potential risks by examining how sensitive financial outcomes are to changes in important variables. This knowledge improves the ability to adapt to various market conditions and enables the implementation of suitable risk mitigation techniques.

Measurement of Uncertainty

The uncertainty connected to financial models, projections, or investment decisions can be quantified with the aid of sensitivity analysis. Analysts can determine the range of possible outcomes and the likelihood of various scenarios by evaluating the sensitivity of financial outcomes to changes in factors.

Identifying Crucial Factors of Sensitivity Analysis

Sensitivity analysis aids in locating the most important factors or hypotheses that have a major impact on financial outcomes. Analysts can identify the factors that impact the outcomes most by changing the inputs and analyzing how those changes affect the outputs. Decision-makers can focus their attention and resources more effectively and strategically by using this knowledge to identify the most important aspects.

Stress Testing

Scenario analysis and stress testing, which are essential for evaluating the robustness of financial models, portfolios, or institutions, are made easier by sensitivity analysis. Analysts can track how financial outcomes react to difficult circumstances by modeling various scenarios and stress variables. This analysis aids in locating weak points, estimating the impact that extreme events might have, and creating backup plans or risk-reduction tactics.

Better Communication

Sensitivity analysis shows the connections between input factors and financial results simply and visually. Stakeholders and decision-makers can better understand the significance and influence of many variables with the aid of visual tools like tornado diagrams and sensitivity charts. This promotes dialogue, enhances stakeholder understanding, and increases the transparency of financial decision-making processes.

Magistral’s Services on Sensitivity Analysis

Financial models have a long history of being trusted tools for determining the boundaries of trade. Due to a recent surge of acquisitions where investors are willing to pay big premiums for rapid growth or a high-impact technology, traditional financial models have undergone qualitative changes. The following is ensured by Magistral’s sensitivity analysis:

-Analyzing the financial model’s unclear input values.

-Predicting potential outcomes and planning for unanticipated risks.

-Aiding the execution of risk assessment techniques.

-Establishing co-relationships between the model’s multiple inputs and output.

-Execution of well-informed judgments.

About Magistral Consulting

Magistral Consulting has helped multiple funds and companies in outsourcing operations activities. It has service offerings for Private Equity, Venture Capital, Family OfficesInvestment BanksAsset Managers, Hedge Funds, Financial Consultants, Real Estate, REITs, RE fundsCorporates, and Portfolio companies. Its functional expertise is around Deal originationDeal Execution, Due Diligence, Financial ModellingPortfolio Management, and Equity Research.

For setting up an appointment with a Magistral representative: visit www.magistralconsulting.com/contact

About the Author

The article is authored by the Marketing Department of Magistral Consulting. For any business inquiries, you can reach out to  prabhash.choudhary@magistralconsulting.com

Introduction

Sensitivity Analysis is a financial modeling tool that examines how the values of a group of independent variables affect a single dependent variable under specified situations. Sensitivity analysis is applied in various domains, from biology and geography to economics and engineering. In the corporate world and economics, sensitivity analysis is employed, also known as a what-if study, often used by financial analysts and economists. It is particularly beneficial for studying and analyzing processes where the outcome is an opaque function of numerous inputs. An opaque function or process cannot be studied or analyzed. Climate models in geography, for example, are typically highly sophisticated. As a result, the precise relationship between the inputs and outputs is unknown. Under a given set of assumptions, sensitivity analysis evaluates how various elements of an independent variable affect a specific dependent variable. In other words, sensitivity analyses look at how various sources of uncertainty in a mathematical model affect the total uncertainty of the model. This strategy is applied within certain boundaries dependent on one or more input variables.

Financial analysts most typically use a Financial Sensitivity Analysis, also known as a What-If analysis or a What-If simulation exercise, to forecast the outcome of a given action when executed under certain conditions. Financial Sensitivity Analysis is conducted within specific parameters set by independent variables.

Advantages of Sensitivity Analysis

The use of sensitivity analysis has several advantages. It is vital to remember that sensitivity analysis employs a set of outcomes based on assumptions and variables, which are then assessed against historical data. As a result, a sensitivity analysis is a model with some room for error that may or may not be completely accurate, but it is a practical and extensively used technique. The following are the main advantages of employing sensitivity analysis:

Advantages of Sensitivity Analysis

Advantages of Sensitivity Analysis

Decision making

Sensitivity Analysis gives decision-makers diverse options to choose from to make better business judgments. Sensitivity analysis aids in making well-informed decisions. Decision-makers use the model to decide how responsive the output is to changes in certain factors. As a result, the analyst can help in drawing factual findings and making the best judgments possible.

Predictions

It thoroughly examines factors, resulting in more accurate forecasts and models.

Areas for improvement

Sensitivity Analysis aids decision-makers in deciding where future improvements should be made. The analyst can be more flexible with the boundaries within which to assess the sensitivities of the dependent variables to the independent variables using Financial Sensitivity Analysis.

Credibility

Financial models gain credibility through sensitivity analysis, which assesses them across various scenarios.

Processes in Sensitivity Analysis

Sensitivity Analysis is a business model that shows how input factors change affect target variables. What-if or simulation analysis is other terms for this model. It is a method of predicting a decision’s outcome based on variables. An analyst can assess the impact of a change in one variable on the outcome by constructing a collection of variables. When performing a sensitivity analysis, both the goal and input variables—also known as independent and dependent variables—are thoroughly examined. The analyst examines how the variables change and how the input variable influences the target. Each sensitivity analysis can be broken down into three steps:

Processes in Sensitivity Analysis

Processes in Sensitivity Analysis

Establishing a base case

The three most typical scenarios in sensitivity analysis and scenario planning are:

-The best-case scenario, or the most optimistic scenario with the most upside potential

-The worst-case scenario or the most pessimistic situation with the most significant risk of failure.

-The base case, or the most cautious scenario, results in the middle of the best and worst-case possibilities.

Analysts will decide which independent and dependent factors are most important to the outcome once a plausible base case scenario has been found.

Determining variable inputs

Cost of goods sold, debt finance, staff salary, client foot traffic, and other input variables are examples of input variables. Cash flows, internal rate of return, net present value (NPV), and net profits are examples of output variables. For example, net present value, which accounts for the time value of money, is often used to estimate if a project would be lucrative. Initial capital, the acceptable rate of return, and the return on investment from cash flows are all factors in NPV.

Testing the variables

Analysts do sensitivity analysis on the assumed independent variables after figuring out the inputs and outputs to thoroughly assess how sensitive their base case is to even the tiniest modifications.

Because it acts as a control, it is critical to use the base case as a frame of reference for the OAT analysis. Without a realistic base case scenario, there is no way to know how the best-case and worst-case possibilities will be affected. Multiple-input variables are more likely to change simultaneously or sequentially in the real world, often in dramatic and unpredictable ways.

Top Practices in Sensitivity Analysis

Layouts in Excel

For a successful sensitivity analysis in Excel, the layout, structure, and strategy are critical. If a model is poorly arranged, both the creator and the users will be perplexed, and the analysis will be prone to errors.

The following are the most critical considerations for Excel layout include putting all the assumptions in one place in the model, formatting all assumptions in a different font color to make them stand out, considering which assumptions to test – only the most critical ones carefully and creating a separate section for the analysis using grouping.

Direct vs. Indirect methods

Different numbers are substituted into a model’s assumption in the direct method. Instead of directly altering the value of an assumption, the indirect method inserts a % change into calculations in the model.

Tables, charts, and graphs

Even the most informed and technically sophisticated finance experts may find sensitivity analysis challenging to understand. Therefore, presenting the results in an easy-to-understand and follow format is critical.

Data tables are an excellent method to explain how changing up to two independent factors affects a dependent variable. The data table below illustrates changes in revenue growth and the EV/EBITDA multiple on a company’s stock price. Tornado charts are an excellent method to simultaneously display the impact of multiple variables. They are named Tornado Charts because they are arranged to make the chart look like a tornado cone, with the most impactful items at the top and the minor impactful items at the bottom.

Limitations in Performing Sensitivity Analysis

Excel is the most used tool for sensitivity analysis and creating financial models. Spreadsheets, on the other hand, leave a lot to be desired. They need much manual entry and leave little space for error. In a two-dimensional spreadsheet, creating a multidimensional analysis is also tricky. When stakeholders arrive with a fresh set of questions to be addressed, analysts must often go back to their drawing board and create new spreadsheets. These are significant to why intelligent firms should consider employing sensitivity analysis-specific financial modeling tools.

Magistral’s services on Sensitivity Analysis

Financial models have long been regarded as a reliable method of finding the contours of trade. Traditional financial models have been tweaked qualitatively due to a recent wave of acquisitions in which investors are into paying significant premiums for explosive growth or a high-impact technology. The sensitivity analysis provided by Magistral ensures the following:

-Analyzing the financial model’s unclear input values

-Predicting potential outcomes and planning for unanticipated risks

-Aiding the execution of risk assessment techniques

-Establishing co-relationships between the model’s multiple inputs and output.

-Execution of well-informed judgments

About Magistral consulting

Magistral Consulting has helped multiple funds and companies in outsourcing operations activities. It has service offerings for Private Equity, Venture Capital, Family OfficesInvestment BanksAsset Managers, Hedge Funds, Financial Consultants, Real Estate, REITs, RE fundsCorporates and Portfolio companies. Its functional expertise is in Deal originationDeal Execution, Due Diligence, Financial ModelingPortfolio Management and Equity Research.

For setting up an appointment with a Magistral representative visit www.magistralconsulting.com/contact

About the Author

The article is Authored by Marketing Department of Magistral Consulting. For any business inquiries, you could reach out to prabhash.choudhary@magistralconsulting.com